DIY Anemometer

Anemometer in action

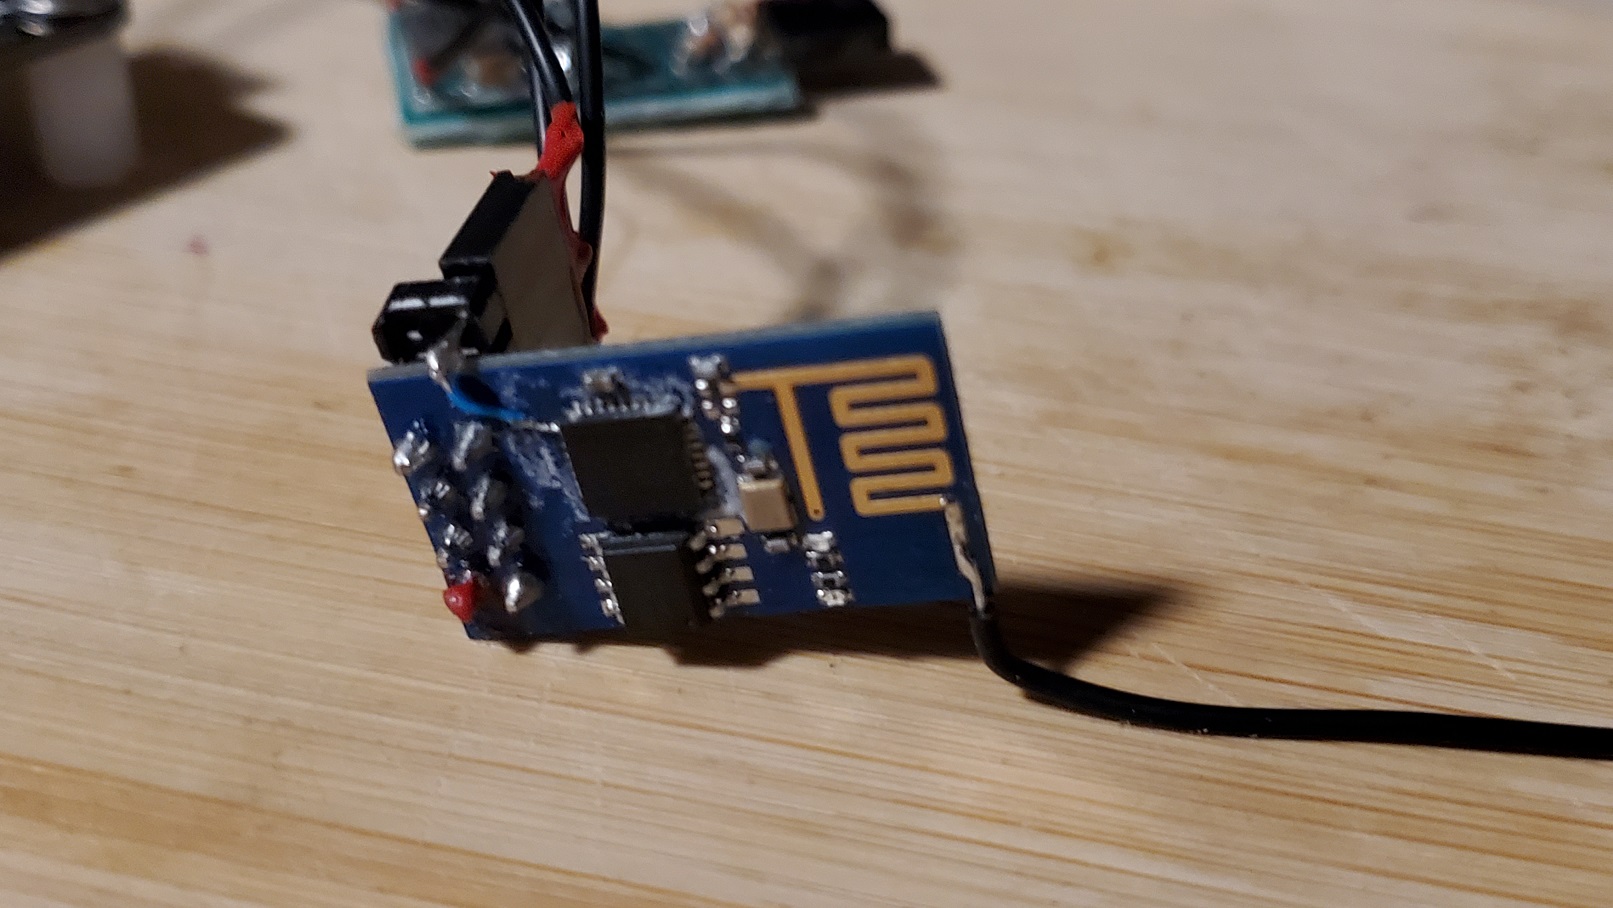
After diving into RC flying last year, I had the idea to create an anemometer to give updates on current wind conditions. With the smaller planes I like to fly, an abundance of wind is always unwelcome, so I wanted to be able to tell at a glance if it's a good time to fly or not. I found a really great 3D print file with instructions on Thingiverse. After printing it and trying it out with the ceramic bearing, I was really happy with how it worked, so got to work on the electroncs. I wanted to be able to put it in the backyard without needing to run any power wires to it, so decided to build something that used a WiFi board that was powered by a battery and charged daily with a solar charger. I decided to try to use an ESP8266-01 (ESP-01), since I had a few modules sitting in the project box and never actually used one. I figured it would work well in this case since I didn't need many GPIO pins (just one actually).

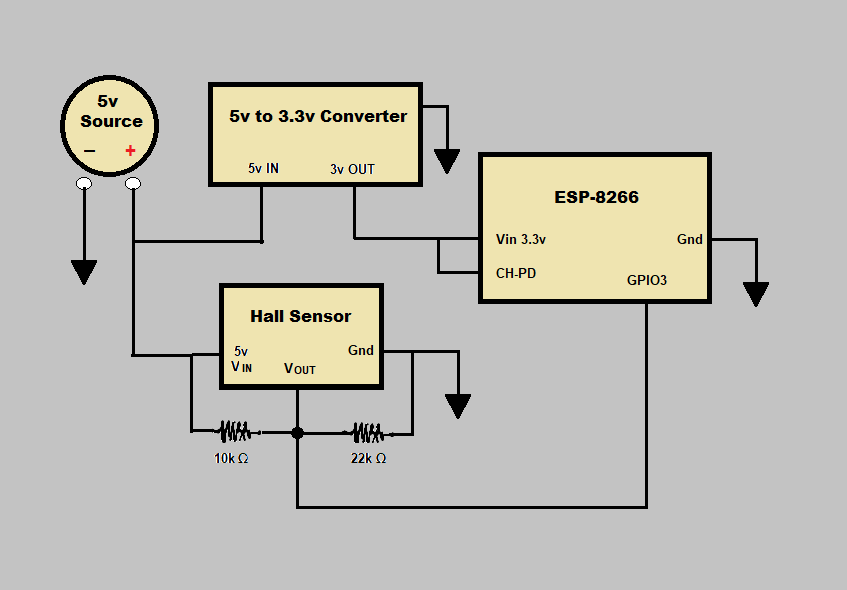
I decided to use a breadboard first to test out the hall sensor and the 5v/3v conversion on the breadboard using resistors. I used a multimeter to test out the sensor with a magnet, reading the output signal voltage. I would need a few resistors as a votage divider that would change the 5 volt output from the hall effect sensor to the lower 3.3 voltage necessary as input for the ESP-01's GPIO input pins. I was able to figure out to use a 10K ohm resistor going from 5v to the output signal pin, as well as a 22K resistor going from Ground to the output signal pin would output the necessary 3.3 volts.

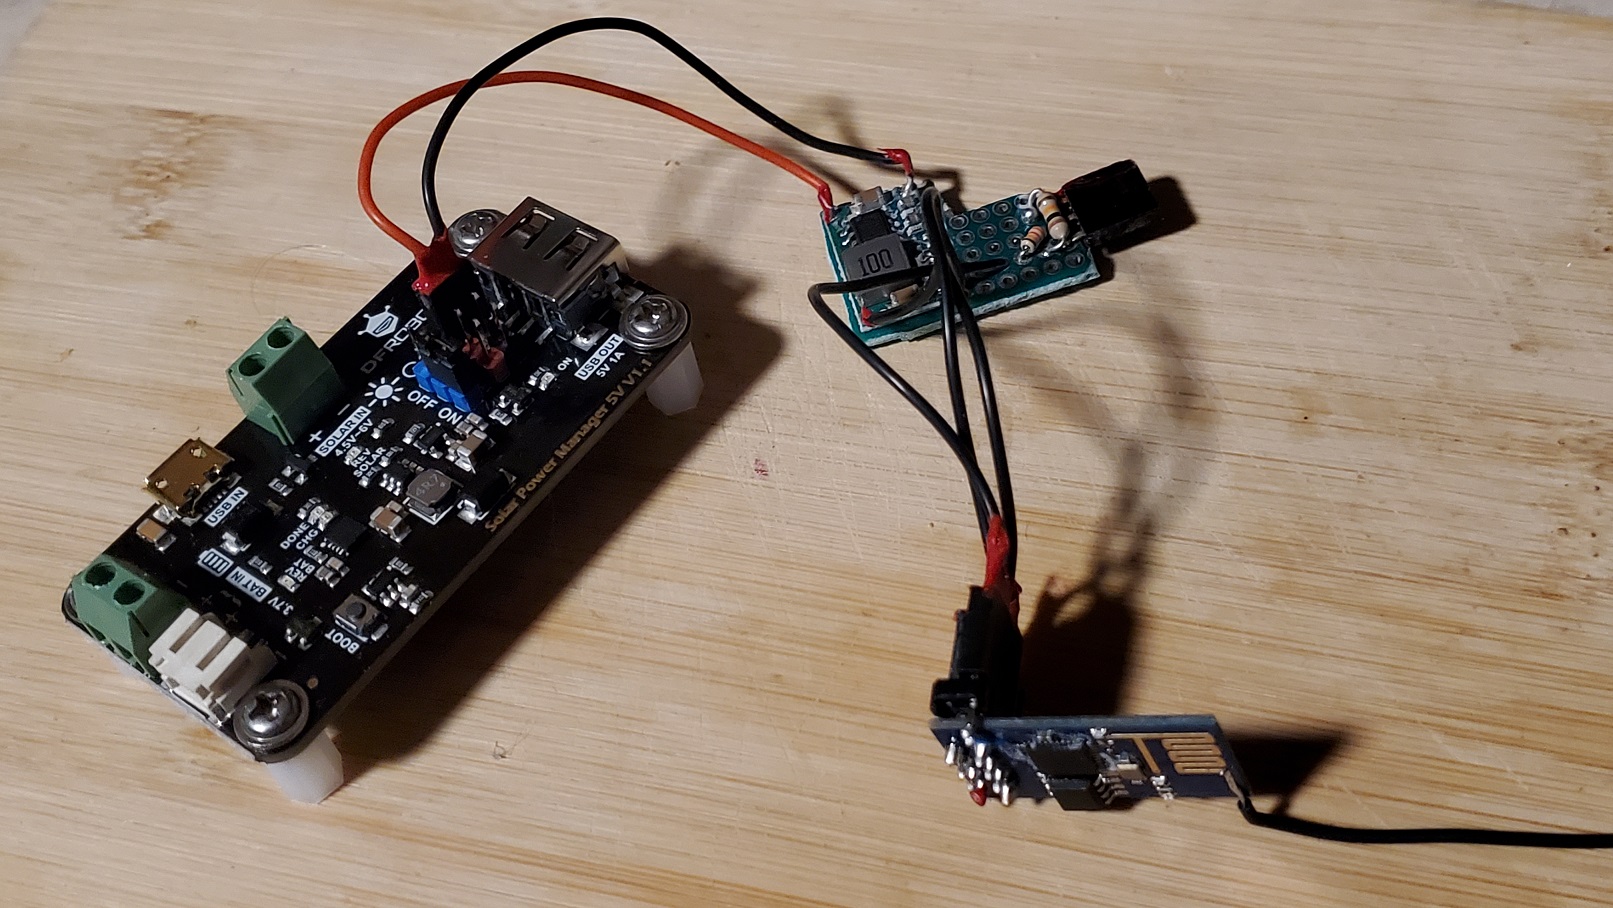
From there I connected the ESP-01 board via FTDI cable. Mine has both 3.3v and 5v, so I was able to use both on the breadboard: 5v for the Hall Effect sensor, and 3.3v for the ESP-01. In the actual circuit, however, I'd need to use a 5v to 3.3v DC-to-DC buck converter board. These are extremely small and cheap now, I use them quite a lot, since they have a wide range of input/output voltages, so can be used in many applications, you just need to adjust a screw to dial in the desired output voltage. Detail the circuit, include the diagram from the notebook, showing the 5v to 3v converter board, necessary since the ESP-01 uses 3.3v, but the solar charger module outputs 5v. As well, the Hall Effect sensor uses 5v, so a few resistors are necessary to create a voltage divider to convert the 5v coming off the Hall Effect sensor output pin that goes into the ESP-01 digital input GPIO pin, which requires 3.3v input, not 5v.

Circuit schematic

Since there are severe limitations on the GPIO, I decided to add an extra one so that I wouldn't have to worry about pins being high/low at boot, since you do if you use any as an input. See this site for reference as to why. As you can see, GPIO0, 1, and 2 can't be used as an input, only GPIO3 could, however, that's used for RX. I was planning on doing this incrementally, doing serial output along the way, so wouldn't be able to use the RX/TX tied GPIO pins for that phase. However, apparently I could have just used the RX pin (GPIO3), since only TX is used to send data and RX would just be if you were sending terminal commands back to the ESP8266, RX could have been used as an input. I thought both RX and TX would have been required to work for any serial communication. See this article.

To get around this now apparently erroneous limitation, I hacked it to use GPIO14, see this post.

Modified ESP-01 with extra GPIO14

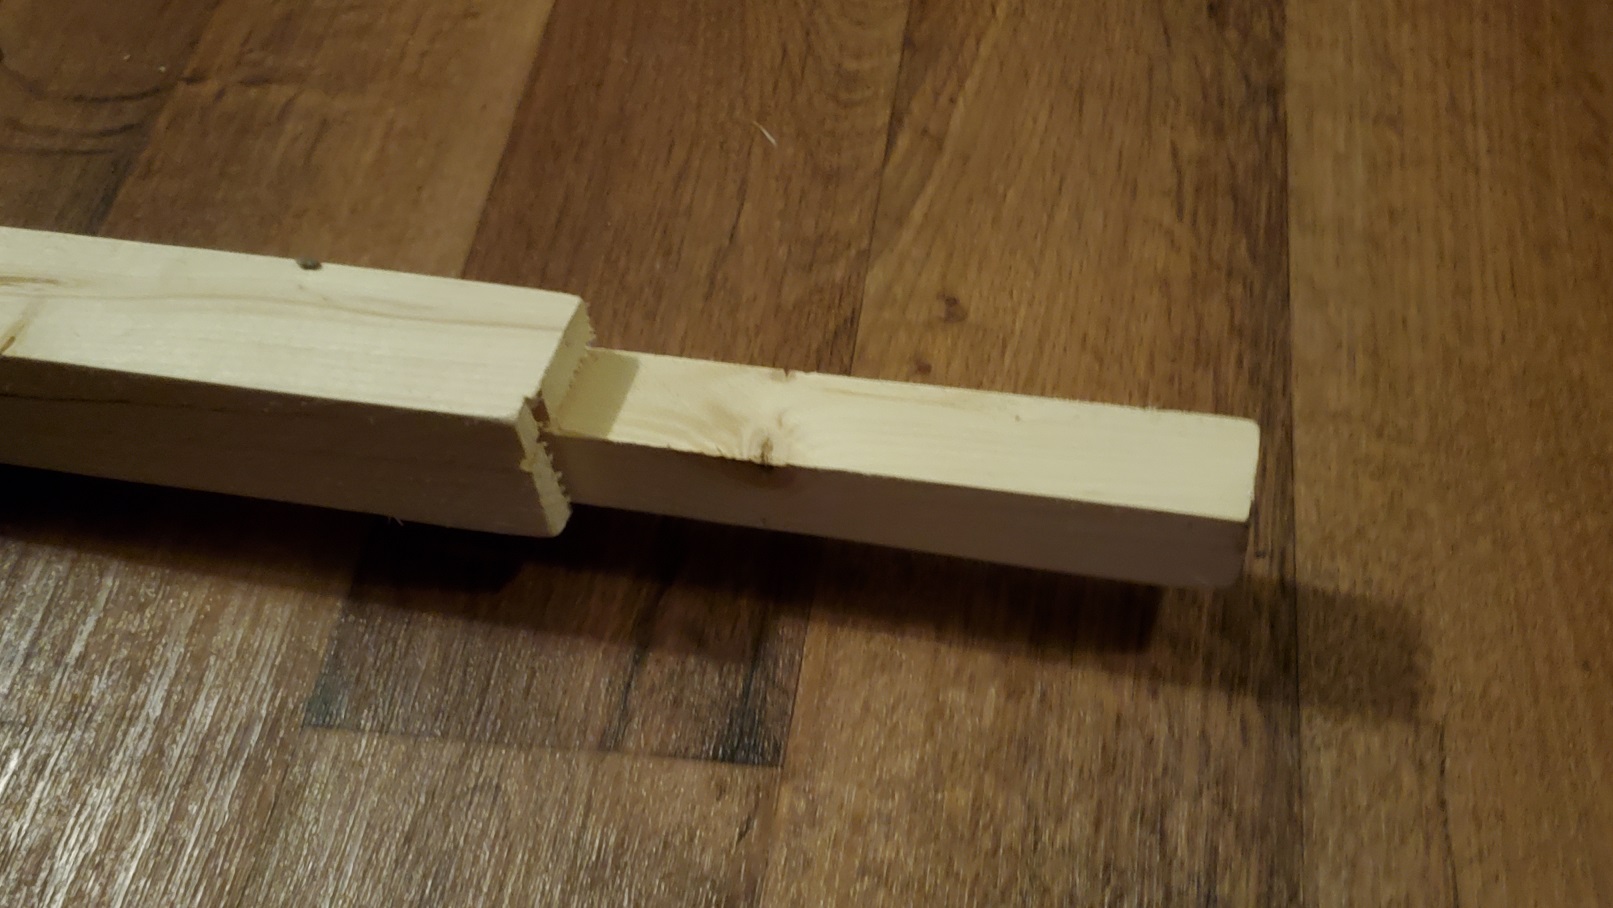
With that worked out, it was time to start work on the post which held the anemometer, electronics enclosure, and the solar panel. Wood post: Look for 2x2 lumber, I figured out looking up "2 inch furring strip" would be your best bet to find what you need locally. The Thingiverse file for the printed part accomodates a one inch by one inch post. I took the 2x2 (actally something like 1 and 5/8, lumber is weird) and used a radial arm saw to cut two sides down.

2 by 2 cut to 1 by 1

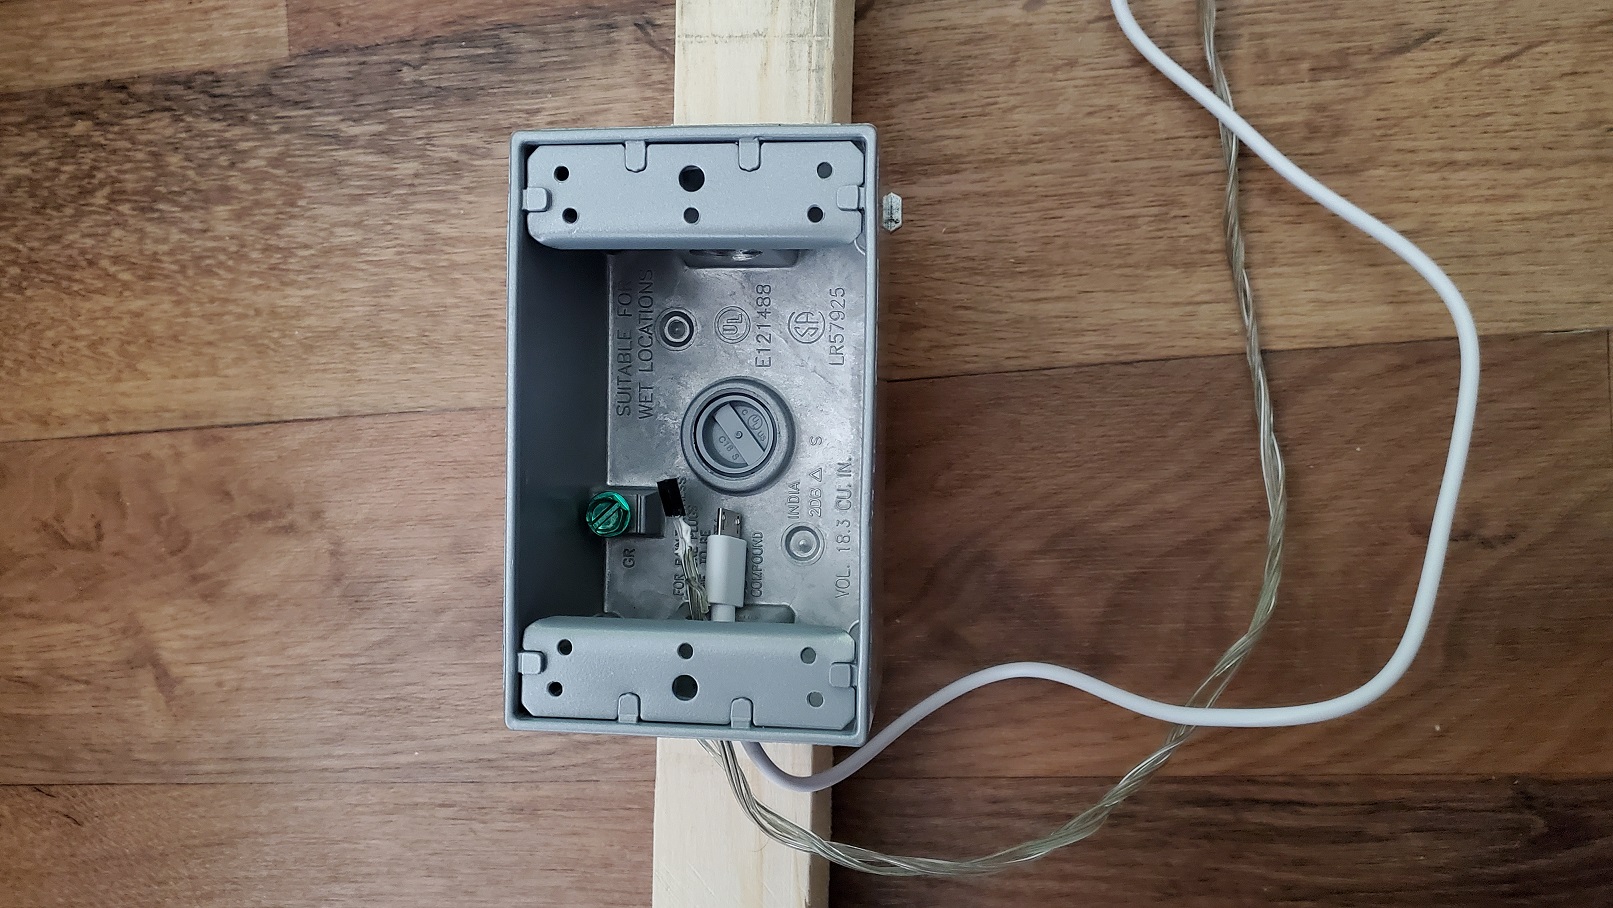
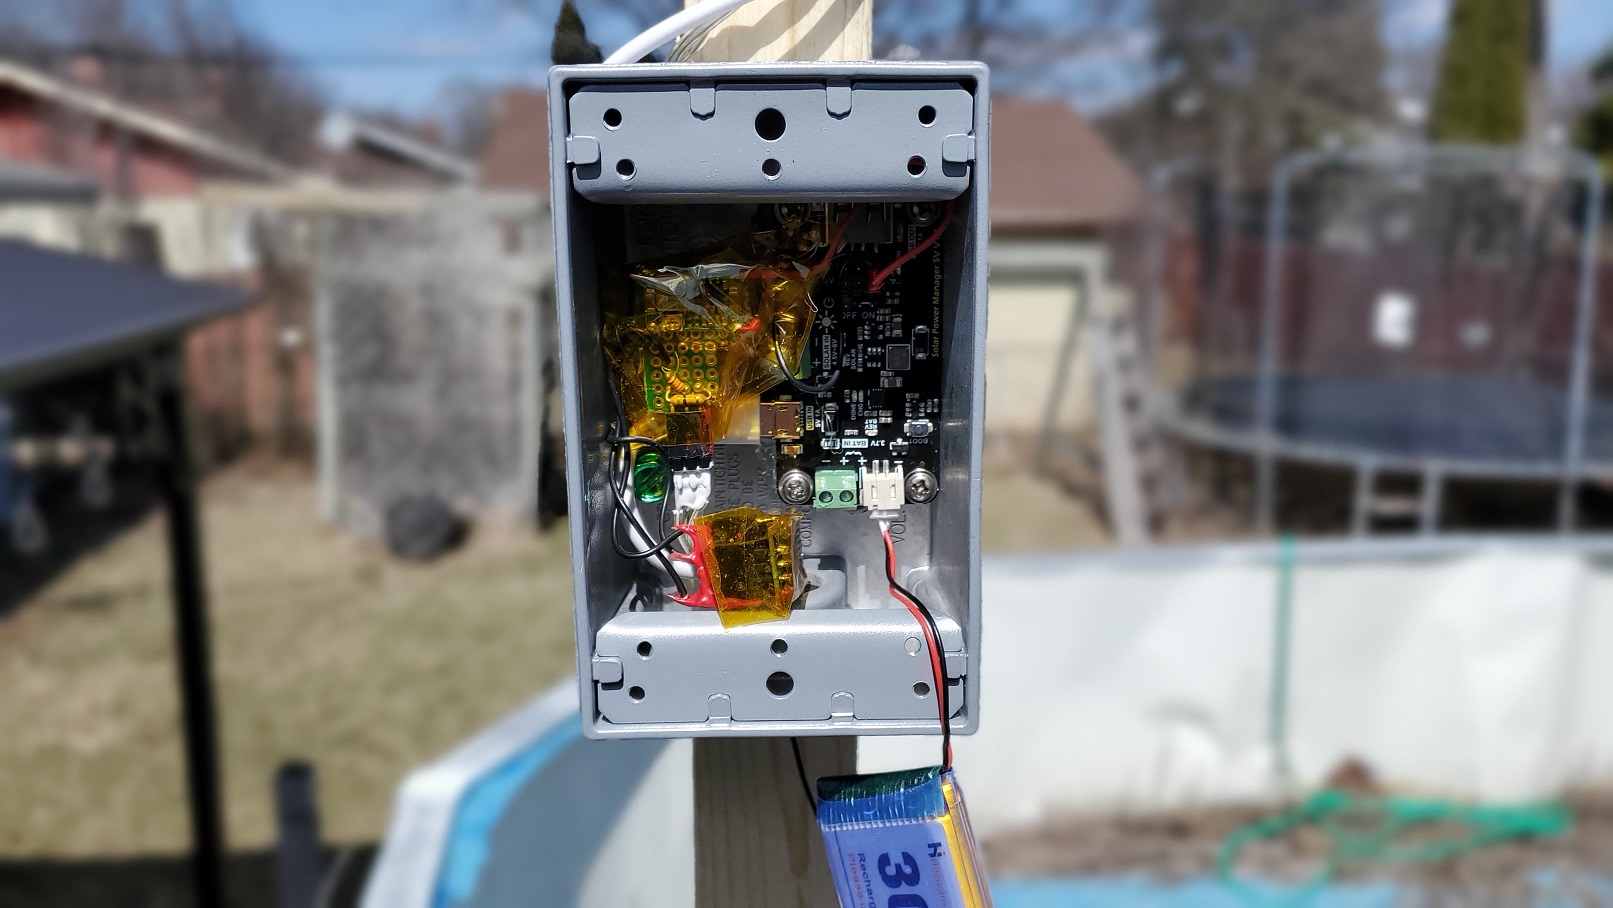
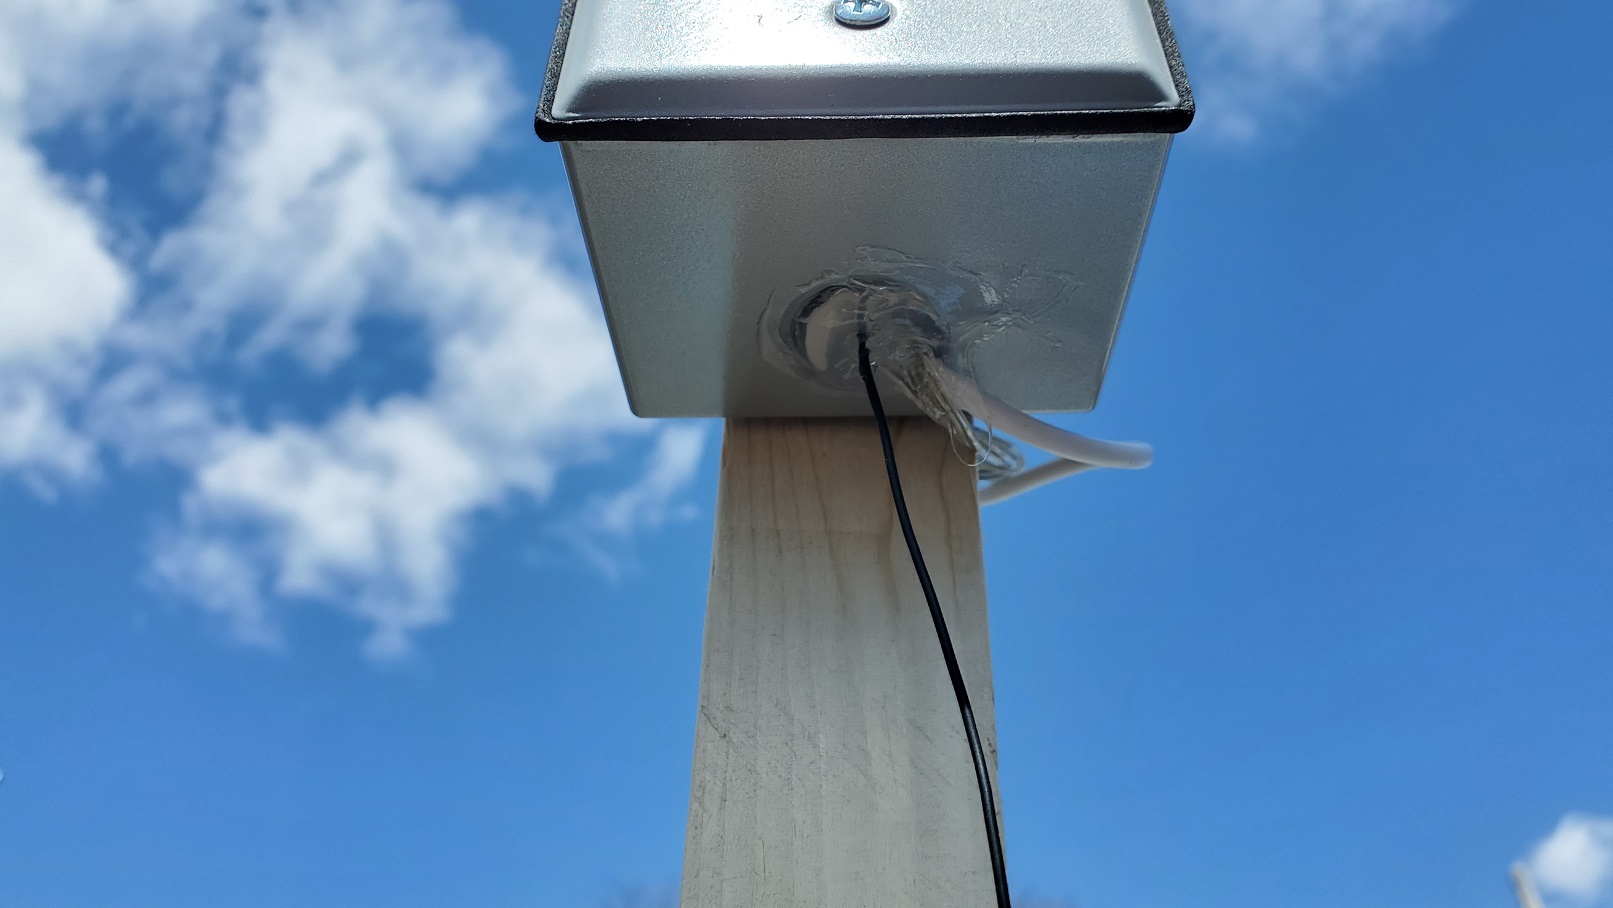
I wanted to put everything in a nice project box, and could have just either bought one online or printed one out. However, I was lazy and wanted something immediately since this was the last thing I needed and so I just went by the local hardware store and bought an electrical outlet enclosure. The plastic ones they had were for indoors so had a bunch of holes, and the plastic enclosed ones were a bit pricey, so I decided to get a metal enclosure that was weatherproof with a cover and some plugs for the non-existent electrical conduit. At home when putting it together it dawned on me: this was going to shield the already weak ESP-01 antenna from working. I ended up soldering a wire antenna that could hang down from the bottom hole for the wires, to which I added silicone sealant afterwards when it was all put together.

Solar charging board, voltage converter board, and modified ESP-01

Ironed out some bugs in the code loops after letting it run for a few days. Also, had to re-adjust and increase the fudge factor a few times to where it seems to match up with current commercial weather site values. The issue is that I had to create the code that counts the revolutions without using interrupts. Why? Because the ESP-01 only allows the use of one interrupt at a time, and the WiFi library uses it, so it will clash when trying to use another one for the hall sensor. So even though I thought I calibrated it pretty well, I think the issue is that I had to do it with the WiFi code commented out, otherwise it would just hang, and when I calibrated it, all the cycles used for WiFi connectivity weren't in use. With it connected to WiFi and running, the counts were done with the WiFi connection loops thrown in, causing the speed to report as much slower that it actually was.

Also, I'm taking a measurement of a full 30 seconds of revolutions, which means it's actually measuring the sustained wind speed average for a half minute, which could have a very high burst of speed for a few seconds, but then way more calm for the rest. If getting the actual high speed burst measurements are important to you, then you'd have to modify the code to make the measurements shorter, like five or ten seconds (or better yet, just use an ESP32 so you can measure more accurately using interrupts).

I could have just used an ESP32 that would allow muliple interrupts, but I felt this was overkill, and I really liked just how small this ESP-01 board is, as well as the low amount of power it was going to draw from the solar charged battery.

A note on the code: as stated above, I added GPIO14 because I thought I would need the extra one since no other pins could have been used as inputs, however, you can still use the RX pin, GPIO3, since that would only be used to receieve serial commands - TX is used to send the output back to the PC (I thought both were required for either to work). I've changed the code accordingly to work with GPIO3.

Another note: modify the "fudge" variable to what works for you, it will probably be different based on what you use, but will get you close if you don't. I calibrated it by connecting it up to my laptop running the Arduino IDE and using the serial monitor, and then driving at 25 mph down a road that didn't have any stops for awhile. I then took an average of the times it was displaying, and used it to adjust the fudge factor I was using previously, which was 10.0, to come up with 2.72. However, once connected up to WiFi, the readings appeared to low, I think because in the testing from the car, I had to comment out all the WiFi code, which eats up cycles, and therefore throws the revolutions per seconds off. It's just based on feel and what weather reports, but for me, it doesn't need to be exact, I just want to know if it's a good day to fly or not.

/*
 Anemometer using an ESP-01 and hall effect sensor without using interrupts

 To install the ESP8266 board, (using Arduino 1.6.4+):
  - Add the following 3rd party board manager under "File -> Preferences -> Additional Boards Manager URLs":
       http://arduino.esp8266.com/stable/package_esp8266com_index.json
  - Open the "Tools -> Board -> Board Manager" and click install for the ESP8266"
  - Select your ESP8266 in "Tools -> Board"

*/

#include <ESP8266WiFi.h>
#include <PubSubClient.h>

// Update these with values suitable for your network.
const char* ssid = "YOUR NETWORK SSID";
const char* password = "YOUR NETWORK PASSWORD";
const char* mqtt_server = "127.0.0.1"; // YOUR MQTT SERVER

// anemometer stuff
const int RecordTime = 30; // Define Measuring Time (Seconds)
const int SensorPin = 3;  // Define Interrupt Pin (GPIO3)
//const float fudge = 2.72;  // multiply wind result by this for calibration
const float fudge = 5.5; // just guessing, previous was too low compared to weather service reports
                        // even tho 2.72 is from 25mph calibration, I think the wifi being on eats
                        // cycles and makes it too low (which wasn't on during calibration)
                        // - could also be from just not being up high enough
int readCounter = 0;
int new_read = 0;
int prev_read = 0;
int avgCount = 0;
int lastAvg = 0;
float cur_windspeed;
float current_readings[10];
float hourly_readings[12];
float daily_readings[24];
float hourly_peak = 0.0;
float prev_hourly_peak = 0.0;
bool new_hourly_hit = false;
bool new_daily_hit = false;
float hour_avg = 0.0;
//float prev_hour_avg = 0.0;
float daily_avg = 0.0;
float daily_peak = 0.0;
int half_min_counter = 0;
int hour_counter = 0;

WiFiClient espClient;
PubSubClient client(espClient);
unsigned long lastMsg = 0;
char msg[50];

void setup_wifi() {

  delay(10);
  // We start by connecting to a WiFi network
  //Serial.println();
  //Serial.print("Connecting to ");
  //Serial.println(ssid);

  WiFi.begin(ssid, password);

  while (WiFi.status() != WL_CONNECTED) {
    delay(500);
    //Serial.print(".");
  }

  randomSeed(micros());

  //Serial.println("");
  //Serial.println("WiFi connected");
  //Serial.println("IP address: ");
  //Serial.println(WiFi.localIP());
}

void callback(char* topic, byte* payload, unsigned int length) {

  // not using to receive and act upon messages currently - possible future functionality
  /*
  Serial.print("Message arrived [");
  Serial.print(topic);
  Serial.print("] ");
  for (int i = 0; i < length; i++) {
    Serial.print((char)payload[i]);
  }
  Serial.println();

  // Switch on the LED if an 1 was received as first character
  if ((char)payload[0] == '1') {
    digitalWrite(BUILTIN_LED, LOW);   // Turn the LED on (Note that LOW is the voltage level
    // but actually the LED is on; this is because
    // it is active low on the ESP-01)
  } else {
    digitalWrite(BUILTIN_LED, HIGH);  // Turn the LED off by making the voltage HIGH
  }
  */
}

void reconnect() {
  // Loop until we're reconnected
  while (!client.connected()) {
    //Serial.print("Attempting MQTT connection...");
    // Create a random client ID
    String clientId = "ESP8266Client-";
    clientId += String(random(0xffff), HEX);
    // Attempt to connect
    if (client.connect(clientId.c_str())) {
      //Serial.println("connected");
      // Once connected, publish an announcement...
      client.publish("sensor/wind/status", "Sensor START");
      // ... and resubscribe
      // NOT USING CURRENTLY
      //client.subscribe("inTopic");
    } else {
      //Serial.print("failed, rc=");
      //Serial.print(client.state());
      //Serial.println(" try again in 5 seconds");
      // Wait 5 seconds before retrying
      delay(5000);
    }
  }
}

void setup() {
  //pinMode(BUILTIN_LED, OUTPUT);     // Initialize the BUILTIN_LED pin as an output
  pinMode(SensorPin, INPUT_PULLUP);
  //Serial.begin(115200);
  setup_wifi();
  client.setServer(mqtt_server, 1883);
  client.setCallback(callback);
}

void measure() {

  new_read = digitalRead(SensorPin);

  if (prev_read != new_read) {
    if(new_read) {
      readCounter++;
    }
    prev_read = new_read;
  }
}

float windspeed(int count) {
  int rpm = count * (60 / RecordTime);
  // wind speed (m/s) = (2 * pi * radius) * (RPM / 60)
  // radius of cups is 12.45 cm
  // mutiply by 2.237 to go from meters/sec to mph
  // fudge is a multiplier to calibrate this, since it's way off
  return (2.0 * 3.14158 * 0.1245) * (rpm / 60.0) * 2.237 * fudge;
}

void loop() {

  measure();

  if (!client.connected()) {
    reconnect();
  }
  client.loop();

  unsigned long now = millis();
  if ((now - lastMsg) > (RecordTime * 1000)) { // 30 sex

    lastMsg = now;
    cur_windspeed = windspeed(readCounter);
    readCounter = 0;
    // just for testing
    //cur_windspeed = random(10, 60) / 3.0;
    if (cur_windspeed > hourly_peak) {
      hourly_peak = cur_windspeed;
      new_hourly_hit = true;
    }
    if (cur_windspeed > daily_peak) {
      daily_peak = cur_windspeed;
      new_daily_hit = true;
    }

    // send MQTT message every min instead of 30 secs
    if (half_min_counter % 2 == 0) {
      snprintf (msg, 50, "%.1f", cur_windspeed, true);
      //Serial.print("Wind Speed: ");
      //Serial.println(msg);
      client.publish("sensor/wind/speed", msg, true);
    }

    current_readings[half_min_counter] = cur_windspeed;

    half_min_counter++;
    if (half_min_counter > 9) { // 5 mins
      half_min_counter = 0;

      // add to hourly readings
      //hourly_readings[avgCount] = cur_windspeed;

      // get average of current readings and add to hourly
      float current_avg = 0.0;
      for (int i = 0; i < 10; i++) {
        current_avg += current_readings[i];
      }
      current_avg /= 10;
      hourly_readings[avgCount] = current_avg;

      // get and announce current hourly avg
      hour_avg = 0;
      for (int i = 0; i < (avgCount + 1); i++) {
        hour_avg += hourly_readings[i];
      }
      hour_avg /= (avgCount + 1);
      snprintf (msg, 50, "%.1f", hour_avg);
      //Serial.print("Hour avg: ");
      //Serial.println(msg);
      client.publish("sensor/wind/hour", msg, true);

      // do hourly high announcement if record broken
      if (new_hourly_hit) {
        new_hourly_hit = false;
        snprintf (msg, 50, "%.1f", hourly_peak);
        //Serial.print("Hourly high: ");
        //Serial.println(msg);
        client.publish("sensor/wind/hourhigh", msg, true);
      }

      // do daily high announcement if record broken
      if (new_daily_hit) {
        new_daily_hit = false;
        snprintf (msg, 50, "%.1f", daily_peak);
        //Serial.print("Daily high: ");
        //Serial.println(msg);
        client.publish("sensor/wind/dayhigh", msg, true);
      }

      avgCount++;
      if (avgCount > 11) { // hourly
        avgCount = 0;

        /*
        // moved to 5 mins interval
        // add to hourly avg
        prev_hour_avg = hour_avg;
        hour_avg = 0;
        for (int i = 0; i < 12; i++) {
          hour_avg += hourly_readings[i];
        }
        hour_avg /= 12;

        // send MQTT messages
        snprintf (msg, 50, "%.1f", hour_avg);
        //Serial.print("Hour avg: ");
        //Serial.println(msg);
        client.publish("sensor/wind/hour", msg, true);
        snprintf (msg, 50, "%.1f", prev_hour_avg);
        */
        snprintf (msg, 50, "%.1f", hour_avg); // use last calculated hour avg for prev hour
        //Serial.print("Prev hour avg: ");
        //Serial.println(msg);
        client.publish("sensor/wind/prevhour", msg, true);
        snprintf (msg, 50, "%.1f", hourly_peak);
        //Serial.print("Hourly high: ");
        //Serial.println(msg);
        client.publish("sensor/wind/hourhigh", msg, true);
        snprintf (msg, 50, "%.1f", prev_hourly_peak);
        //Serial.print("Prev hour high: ");
        //Serial.println(msg);
        client.publish("sensor/wind/prevhourhigh", msg, true);
        snprintf (msg, 50, "%.1f", daily_peak);
        //Serial.print("Daily high: ");
        //Serial.println(msg);
        client.publish("sensor/wind/dayhigh", msg, true);

        // add to daily readings, daily avg and report
        daily_readings[hour_counter] = hour_avg;
        daily_avg = 0;
        for (int i = 0; i < (hour_counter + 1); i++) {
          daily_avg += daily_readings[i];
        }
        daily_avg /= (hour_counter + 1);
        snprintf (msg, 50, "%.1f", daily_avg);
        client.publish("sensor/wind/daily", msg, true);

        hour_counter++;
        if (hour_counter > 23) { // daily - record ave and peak to prev daily
          hour_counter = 0;

          // send MQTT message
          snprintf (msg, 50, "%.1f", daily_avg);
          //Serial.print("Prev daily: ");
          //Serial.println(msg);
          client.publish("sensor/wind/prevdaily", msg, true);
          snprintf (msg, 50, "%.1f", daily_peak);
          //Serial.print("Prev high: ");
          //Serial.println(msg);
          client.publish("sensor/wind/prevhigh", msg, true);
          daily_peak = 0.0;
        }
        prev_hourly_peak = hourly_peak;
        hourly_peak = 0.0;
      }
    }
  }
}
  

While purchasing items on AliExpress, I came across a small 3.5 inch "smart screen" for under $10. It plugs into a USB-C cable attached to your computer, and can display stuff like CPU usage, temps, etc. Interesting, but I don't care about that kind of thing so much, but was interested if it could show any kind of information you wanted on the screen. Officially you can't. However, hackers to the rescue, as they've created a repository for a bunch of these types of screens where you can not only change the templates, but can display custom images and text, which is exactly what I wanted. These are called "Turing Smart Screens", and you can find the repository here, along with how to display custom information here. When I bought it, I had it in my head that it could be something to display information from JARVIS (my custom home automation software), as well as just this sort of sensor information for the wind speed. It was actually pretty straightforward and easy to do, as the programming is done in Python. Software runs on Windows, Linux, and MacOS. The program I wrote uses Windows (Powershell using Python), but I may change it to use my Raspberry Pi server instead at some point so it's always on and data available on the screen.

Accessory USB Screen

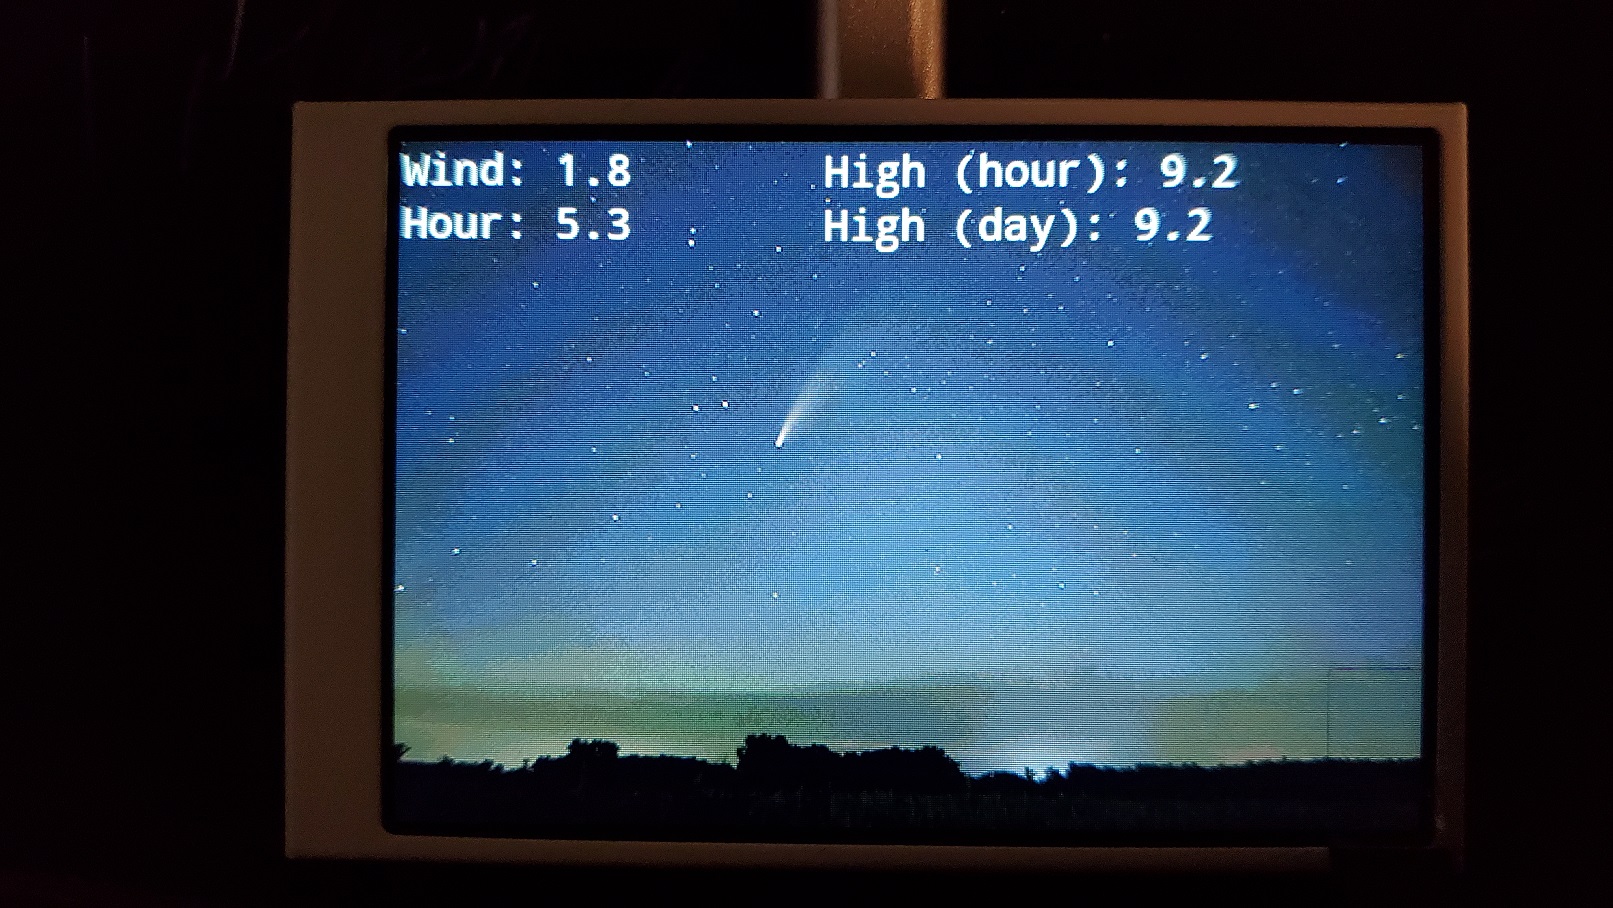
For the Turing Smart Screen code below, change the "host" var from "127.0.0.1" to whatever your MQTT server IP is, change the MQTT topics to whatever you need, and change the font, size, background, etc., to what works for you or use what's in the orginal example code from the repo. This is just a customized version of the that code, with the MQTT functionality added.

#!/usr/bin/env python
# turing-smart-screen-python - a Python system monitor and library for USB-C displays like Turing Smart Screen or XuanFang
# https://github.com/mathoudebine/turing-smart-screen-python/

# Copyright (C) 2021-2023  Matthieu Houdebine (mathoudebine)
#
# This program is free software: you can redistribute it and/or modify
# it under the terms of the GNU General Public License as published by
# the Free Software Foundation, either version 3 of the License, or
# (at your option) any later version.
#
# This program is distributed in the hope that it will be useful,
# but WITHOUT ANY WARRANTY; without even the implied warranty of
# MERCHANTABILITY or FITNESS FOR A PARTICULAR PURPOSE.  See the
# GNU General Public License for more details.
#
# You should have received a copy of the GNU General Public License
# along with this program.  If not, see .

# This file is a simple Python test program using the library code to display custom content on screen (see README)

import os
import signal
import sys
import time
from datetime import datetime
import paho.mqtt.client as mqtt

# Import only the modules for LCD communication
from library.lcd.lcd_comm_rev_a import LcdCommRevA, Orientation
from library.lcd.lcd_comm_rev_b import LcdCommRevB
from library.lcd.lcd_comm_rev_c import LcdCommRevC
from library.lcd.lcd_comm_rev_d import LcdCommRevD
from library.lcd.lcd_simulated import LcdSimulated
from library.log import logger

# Set your COM port e.g. COM3 for Windows, /dev/ttyACM0 for Linux, etc. or "AUTO" for auto-discovery
# COM_PORT = "/dev/ttyACM0"
# COM_PORT = "COM5"
COM_PORT = "AUTO"

# Display revision:
# - A      for Turing 3.5" and UsbPCMonitor 3.5"/5"
# - B      for Xuanfang 3.5" (inc. flagship)
# - C      for Turing 5"
# - D      for Kipye Qiye Smart Display 3.5"
# - SIMU   for simulated display (image written in screencap.png)
# To identify your smart screen: https://github.com/mathoudebine/turing-smart-screen-python/wiki/Hardware-revisions
REVISION = "A"

# Display width & height in pixels for portrait orientation
# /!\ Do not switch width/height here for landscape, use lcd_comm.SetOrientation below
# 320x480 for 3.5" models
# 480x480 for 2.1" models
# 480x800 for 5" models
# 480x1920 for 8.8" models
WIDTH, HEIGHT = 320, 480

assert WIDTH <= HEIGHT, "Indicate display width/height for PORTRAIT orientation: width <= height"

stop = False

if __name__ == "__main__":

    def sighandler(signum, frame):
        global stop
        stop = True


    # Set the signal handlers, to send a complete frame to the LCD before exit
    signal.signal(signal.SIGINT, sighandler)
    signal.signal(signal.SIGTERM, sighandler)
    is_posix = os.name == 'posix'
    if is_posix:
        signal.signal(signal.SIGQUIT, sighandler)

    # Build your LcdComm object based on the HW revision
    lcd_comm = None
    if REVISION == "A":
        logger.info("Selected Hardware Revision A (Turing Smart Screen 3.5\" & UsbPCMonitor 3.5\"/5\")")
        # NOTE: If you have UsbPCMonitor 5" you need to change the width/height to 480x800 below
        lcd_comm = LcdCommRevA(com_port=COM_PORT, display_width=WIDTH, display_height=HEIGHT)
    elif REVISION == "B":
        logger.info("Selected Hardware Revision B (XuanFang screen 3.5\" version B / flagship)")
        lcd_comm = LcdCommRevB(com_port=COM_PORT, display_width=WIDTH, display_height=HEIGHT)
    elif REVISION == "C":
        logger.info("Selected Hardware Revision C (Turing Smart Screen 5\")")
        lcd_comm = LcdCommRevC(com_port=COM_PORT, display_width=WIDTH, display_height=HEIGHT)
    elif REVISION == "D":
        logger.info("Selected Hardware Revision D (Kipye Qiye Smart Display 3.5\")")
        lcd_comm = LcdCommRevD(com_port=COM_PORT, display_width=WIDTH, display_height=HEIGHT)
    elif REVISION == "SIMU":
        logger.info("Selected Simulated LCD")
        lcd_comm = LcdSimulated(display_width=WIDTH, display_height=HEIGHT)
    else:
        logger.error("Unknown revision")
        try:
            sys.exit(1)
        except:
            os._exit(1)

    # Reset screen in case it was in an unstable state (screen is also cleared)
    lcd_comm.Reset()

    # Send initialization commands
    lcd_comm.InitializeComm()

    # Set brightness in % (warning: revision A display can get hot at high brightness! Keep value at 50% max for rev. A)
    lcd_comm.SetBrightness(level=10)

    # Set backplate RGB LED color (for supported HW only)
    lcd_comm.SetBackplateLedColor(led_color=(255, 255, 255))

    # Set orientation (screen starts in Portrait)
    lcd_comm.SetOrientation(orientation=Orientation.LANDSCAPE)

    # Define background picture
    #background = f"res/backgrounds/example_{ lcd_comm.get_width() }x{ lcd_comm.get_height() }.png"
    background = f"res/backgrounds/Neowise_2020_IMG_1398_TURING.png"

    # Display sample picture
    logger.debug("setting background picture")
    start = time.perf_counter()
    lcd_comm.DisplayBitmap(background)
    end = time.perf_counter()
    logger.debug(f"background picture set (took { end - start:.3f } s)")

    # Display sample text
    #lcd_comm.DisplayText("Basic text", 50, 85)

    # Display custom text with solid background
    #lcd_comm.DisplayText("Custom italic multiline text\nright-aligned", 5, 120,
    #                     #font="res/fonts/roboto/Roboto-Italic.ttf",
    #                     font="res/fonts/droid-sans-mono/DroidSansMono.ttf",
    #                     font_size=20,
    #                     font_color=(0, 0, 255),
    #                     background_color=(255, 255, 0),
    #                     align='right')

    # Display custom text with transparent background
    #lcd_comm.DisplayText("Transparent bold text", 5, 180,
    #                     #font="res/fonts/geforce/GeForce-Bold.ttf",
    #                     font="res/fonts/droid-sans-mono/DroidSansMono.ttf",
    #                     font_size=30,
    #                     font_color=(255, 255, 255),
    #                     background_image=background)

    # Display the current time and some progress bars as fast as possible
    bar_value = 0

    def on_connect(client, userdata, flags, reason_code, properties=None):
        #client.subscribe(topic="sensor/patiodoor/state")
        client.subscribe(topic="sensor/wind/speed")
        client.subscribe(topic="sensor/wind/hour")
        client.subscribe(topic="sensor/wind/hourhigh")
        client.subscribe(topic="sensor/wind/dayhigh")

    def display_message(msgtext, msg_x, msg_y):
        lcd_comm.DisplayText(msgtext, msg_x, msg_y,
                             font="res/fonts/droid-sans-mono/DroidSansMono.ttf",
                             font_size=20,
                             font_color=(255, 255, 200),
                             background_image=background)

    #def on_message(client, userdata, message, properties=None):
    #    #print(f"{ datetime.now() } Message: { message.payload } Topic: '{ message.topic }'")
    #    lcd_comm.DisplayText(f"{ message.topic }: { message.payload }", 2, 2,
    #                         font="res/fonts/droid-sans-mono/DroidSansMono.ttf",
    #                         font_size=20,
    #                         font_color=(255, 100, 100),
    #                         background_image=background)

    def on_message(client, userdata, message, properties=None):

        if message.topic == 'sensor/wind/speed':
            display_message(f"Wind: { message.payload.decode('utf-8') } ", 2, 2)

        if message.topic == 'sensor/wind/hour':
            display_message(f"Hour: { message.payload.decode('utf-8') } ", 2, 27)

        if message.topic == 'sensor/wind/hourhigh':
            display_message(f"High (hour): { message.payload.decode('utf-8') } ", 200, 2)

        #if message.topic == 'sensor/wind/prevhour':

        #if message.topic == 'sensor/wind/prevhourhigh':

        #if message.topic == 'sensor/wind/daily':

        if message.topic == 'sensor/wind/dayhigh':
            display_message(f"High (day): { message.payload.decode('utf-8') } ", 200, 27)


    def on_subscribe(client, userdata, mid, qos, properties=None):
        print(f"{ datetime.now() } Subscribed with Qos { qos }")

    client = mqtt.Client(client_id="", protocol=mqtt.MQTTv311, clean_session=True)
    client.on_connect = on_connect
    client.on_message = on_message
    client.on_subscribe = on_subscribe
    client.connect(host="127.0.0.1", port=1883, keepalive=60)

    while not stop:
        #start = time.perf_counter()
        #lcd_comm.DisplayText(str(datetime.now().time()), 160, 2,
                             #font="res/fonts/roboto/Roboto-Bold.ttf",
                             #font="res/fonts/droid-sans-mono/DroidSansMono.ttf",
                             #font_size=20,
                             #font_color=(255, 100, 100),
                             #background_image=background)

        #end = time.perf_counter()
        #logger.debug(f"refresh done (took { end - start:.3f } s)")
        client.loop_forever()

    # Close serial connection at exit
    lcd_comm.closeSerial()
  

I utilize MQTT by having my Raspberry Pi server running Mosquitto. I had already done a little bit of MQTT via PHP, but was curious if the same could be done with Websockets instead. Indeed there is, quite easily, using a JavaScipt library, as well as setting up the MQTT server to use Websockets, since Mosquitto supports it right out of the box. I was able to create a web page on my local server that would display all the MQTT wind data topics in real time. I've included links below to get started if you're curious how to do the same.

Parts and Links